

In this article, we will learn to Calculate Discrete Probability in Excel.
Scenario:
We now define the concept of probability distributions for discrete random variables, i.e. random variables that take a discrete set of values. Such random variables generally take a finite set of values (heads or tails, people who live in London, scores on an IQ test), but they can also include random variables that take a countable set of values (0, 1, 2, 3, …).
Probability means the probable chances of the event occurring in a situation. For example probability of occurring head in tossing of coin which is half (½) as there are two possible outcomes head or tail. Like the probability of raining on a cloudy day is much higher than raining on a clear day. Probability gives us the idea of the occurrence of that event. The mathematical formulation to calculate probability is given by :
Probability = Favourable outcome / total outcome
You can also relate the probability for occuring the rolling of dice or occurrence of getting king in a deck of regular cards. These are the basic probability values which can be calculated manually or by simple mathematical formulation but PROB function helps you find probability for the range of occurrences having discrete probabilities for the event. Let's understand how to use the PROB function.
PROBABILITY formula in Excel
PROB function returns the probability for an event or range of events providing lower and upper limit of an event. X_range and prob_range are different events and their probabilities.
PROB Function syntax:
| =PROB(x_range, prob_range, lower_limit, [upper_limit]) |
x_range : different events given as array
prob_range : different respective probabilities given as array
lower_limit : probability of an event or lower limit of an event
upper_limit : [optional] only needed when range is given as argument
Example :
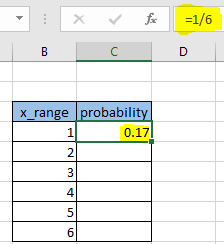
All of these might be confusing to understand. Let's understand how to use the function using an example. First we will learn the manual way of calculating probability. Here first we take the example of rolling a regular to dice having 1 to 6 numbers. There are equal chances of getting each number in a roll. So the probability of getting one equal to
Use the formula:
| =1/6 |
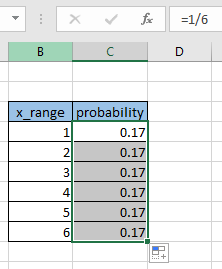
The same will be the probability for each number. So copy the formula using the Ctrl + D or dragging down the C4 cell.
Now we want to know the probability of getting 1 or 2 or 3 on rolling the same die. We use the PROB function
Use the formula:
| =PROB(B4:B9, C4:C9, 1, 3) |
Explanation :
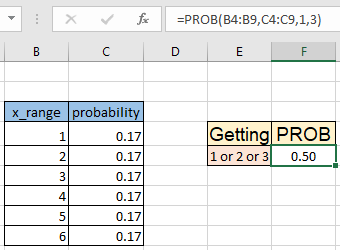
As you can see the formula returns 0.5 i.e. there are half the chances of getting 1 or 2 or 3 in a roll a dice.
Now let's extend this example for the roll of two dice and we need to calculate the probability of the sum of numbers occurring on the roll. Here we java a table for the Sum on roll of two dice.
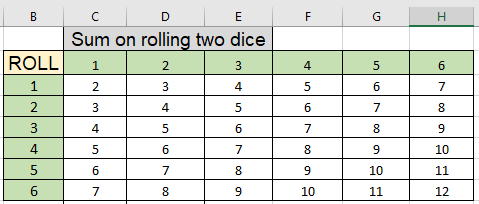
Now we know the lowest sum we can get is 2 and the highest sum is 12. We use the COUNTIF function to calculate the individual probabilities. Here the sum of getting a number is given as named range data (C3:H8)
Use the formula to count the number of 2s in the data
Use the formula:
| =COUNTIF(data,C11)/COUNT(data) |
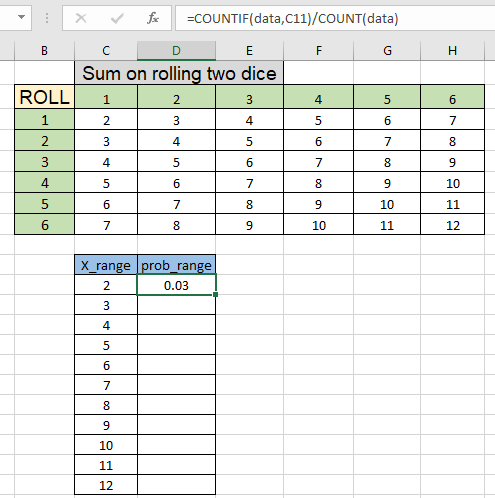
As you can see, using the simple mathematical formula we calculate the probability of getting sum 2 on rolling two dice. Now copy the formula to other cells using the Ctrl + D shortcut or dragging down D11 cell.
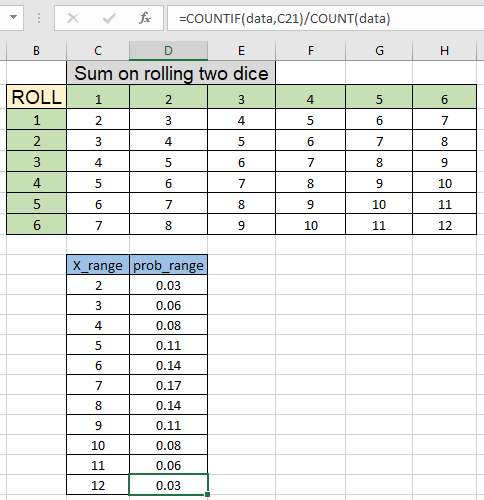
As you can see we got all the individual probabilities. This will be used as prob)range for the prob function. You must have heard of the game called lucky Seven where person betting can bet on the sum of numbers on rolling two die, there are three events which are less than 7, 7 or greater than 7. In this a person bets on either sum is less than 7 or greater than 7, he gets his bet amount but he bets on exact sum 7 he gets triple the bet amount. Why does this happen? Let's understand this with probability.
Use the formula to get the probability of getting a sum less than 7.
| =PROB(C11:C21, D11:D21, 2, 6) |
Explanation :
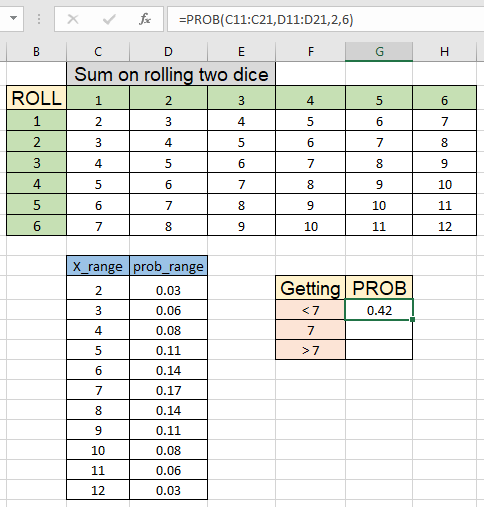
As you can see, there is 0.42 or 42 percent chance of this happening. Now calculate the getting exact 7.
Use the formula:
| =PROB(C11:C21, D11:D21, 7) |
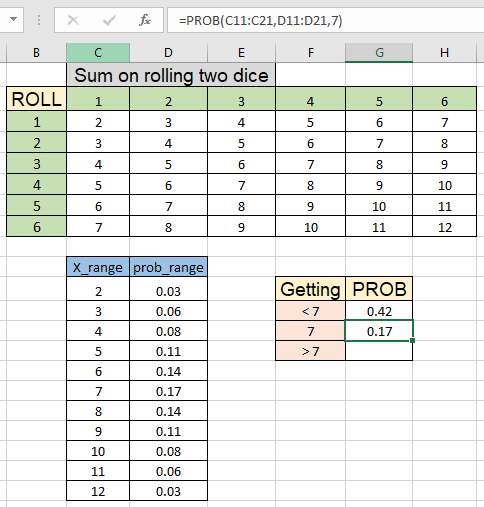
As you can see, there are 0.17 or 17 % chances of this event happening. Now calculate the last event happening which is greater than 7.
Use the formula to get the probability of getting a sum greater than 7.
| =PROB(C11:C21, D11:D21, 8, 12) |
Explanation :
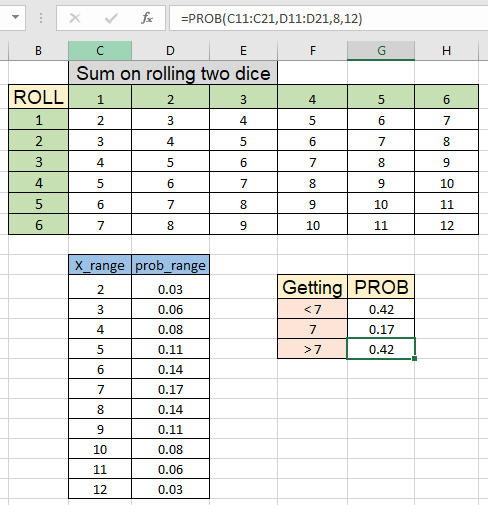
As you can see the formula returns 0.42 or 42%. So you can clearly see the difference of probability between the three events.
Here are all the observational notes using the formula in Excel
Notes :
Hope this article about How to Calculate Discrete Probability in Excel is explanatory. Find more articles on calculating values and related Excel formulas here. If you liked our blogs, share it with your friends on Facebook. And also you can follow us on Twitter and Facebook. We would love to hear from you, do let us know how we can improve, complement or innovate our work and make it better for you. Write to us at info@exceltip.com.
Related Articles :
How to use the VAR function in Excel : Calculate the variance for the sample dataset in excel using the VAR function in Excel.
How to Calculate Standard Deviation in Excel : To calculate the standard deviation we have different functions in Excel. The standard deviation is the square root of the variance value but It tells more about the dataset than variance.
Regressions Analysis in Excel : Regression is an Analysis Tool, which we use for analyzing large amounts of data and making forecasts and predictions in Microsoft Excel.
How to Create Standard Deviation Graph : The standard deviation tells how much data is clustered around the average of the data. Learn how to create a standard deviation graph here.
How to use Excel NORMDIST Function : Calculate the Z score for the normal cumulative distribution for the pre specified values using the NORMDIST function in Excel.
How to use Excel NORM.INV Function : Calculate the inverse of Z score for the normal cumulative distribution for the pre-specified probability values using the NORM.INV function in Excel.
Popular Articles :
50 Excel Shortcuts to Increase Your Productivity : Get faster at your tasks in Excel. These shortcuts will help you increase your work efficiency in Excel.
How to use the VLOOKUP Function in Excel : This is one of the most used and popular functions of excel that is used to lookup value from different ranges and sheets.
How to use the IF Function in Excel : The IF statement in Excel checks the condition and returns a specific value if the condition is TRUE or returns another specific value if FALSE.
How to use the SUMIF Function in Excel : This is another dashboard essential function. This helps you sum up values on specific conditions.
How to use the COUNTIF Function in Excel : Count values with conditions using this amazing function. You don't need to filter your data to count specific values. Countif function is essential to prepare your dashboard.
The applications/code on this site are distributed as is and without warranties or liability. In no event shall the owner of the copyrights, or the authors of the applications/code be liable for any loss of profit, any problems or any damage resulting from the use or evaluation of the applications/code.


