Well, the standard deviation is a calculated number that represents the dispersion of data from the mean of the data. It is calculated as the square root of variance. This is used to tell how far data is spread from mean.
It is usually denoted as sigma (?). In the below graph, the curved line represents the standard deviation and the center line in the mean of the data.

How to Calculate Standard Deviation in Excel

Excel provides two functions to calculate the standard deviation. STDEV.P and STDEV.S.
STDEV.P is used to calculate standard deviation when you have captured whole population data.
When you have a sample data of a large data, you should use STDEV.S function. It is more accurate than the standard deviation of the population (STDEV.P).
If you calculate standard deviation on the same data, using STDEV.S and STDEV.P. The STDEV.S will return a larger standard deviation. The standard deviation of a sample considers the chances of error and subtracts 1 from the denominator (number of observations). This is called Bessel’s Correction.
In the above image, the standard deviation formula in D2 and D3 are:
How to calculate standard deviation manually?

Well as I stated in the beginning, standard deviation is squire root of variance. And we have an excel function for calculating variance too. But we won’t use it. We will do it using the old school method.
The formula for standard deviation is
Standard Deviation (?)= SQRT(Variance)
And Variance is
Variance = (sum of squared difference from mean) / number of observations
To calculate variance we need to calculate the difference of each number from the meaning of the data.
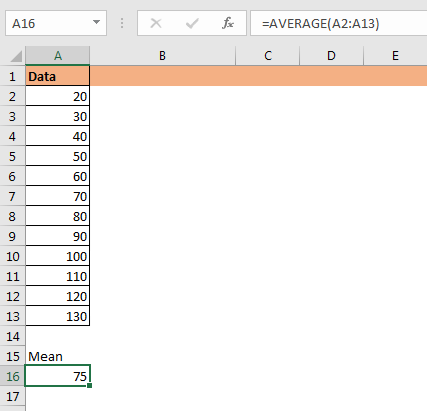
We get mean using the AVERAGE function.
In cell A16 we have.
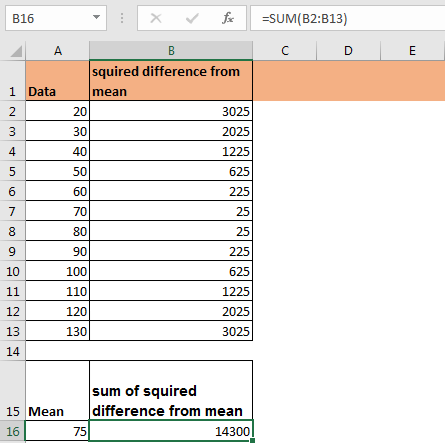
Now to calculate the squared difference from mean of each number, we write this formula in B2. copy down this formula.
Here mean is A16.
Now to get sum of squired difference from mean, sum range B2:B13.

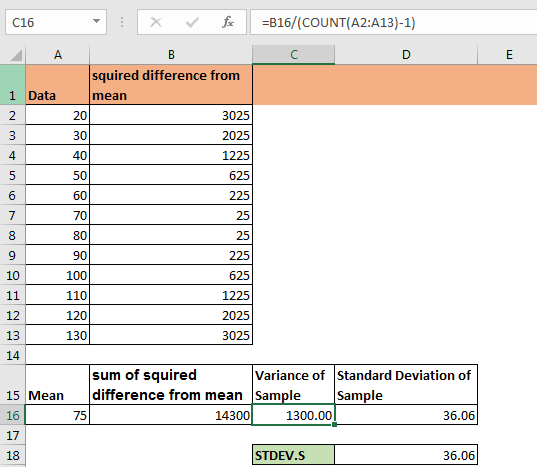
To calculate variance of population, we just need to divide this sum of squired difference from mean by total number of observations. That is 12. Write this formula in C16 for variance of population.
or

This our variance of population. Which can be used to get Standard Deviation of Population (STDEV.P) by getting squire root of it.

To get standard deviation of sample we just need to subtract 1 from count of observations while calculating variance. This variance will variance of sample (VAR.P) and squire root of it will be Standard Deviation of Sample (STDEV.S).

The formula in C16 in above excel snapshot can be:
This is the manual calculation of standard deviation. Although, you don’t need to do manual calculation of standard deviation, it is good to know how the standard deviation is calculated in back ground.
There are two older function for standard deviation in excel, STDEVS and STDEVP. They do the same thing as above standard deviation formulas. Don’t confuse between them. Excel recommends to use new STDEV.S and STDEV.P.
So yeah guys, this is how you do standard deviation calculation in excel. I hope it was helpful. If you have any doubt regarding this article or any other topic related with excel statistics or VBA, feel free to ask it in the comments section below.
Related Articles:
How to Create Standard Deviation Graph in Excel
How to Use VAR Function in Excel
How to Use STDEV Function in Excel
Calculating Coefficient of variation in Excel
How To Use Excel STDEV.P Function
How to Use Excel NORMDIST Function
How to Calculate Mean in Excel
How to Create Standard Deviation Graph in Excel
How to use VAR.P function in Excel
How to Use STDEV.S Function in Excel
Popular Articles:
The applications/code on this site are distributed as is and without warranties or liability. In no event shall the owner of the copyrights, or the authors of the applications/code be liable for any loss of profit, any problems or any damage resulting from the use or evaluation of the applications/code.