The bell curve or standard deviation graph is used to visualise the spread of data. Excel is powerful tool to create graphs and visualise data and it can be used to create the bell graph.
The standard deviation tells how much the data is clustered around the mean of the data. Lower standard deviation tells that the data is less spread and higher standard deviation tells that data is more spread.

Example :
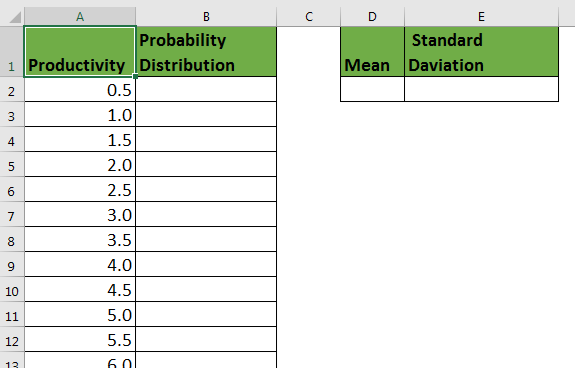
Let’s say, I have productivity data of my 77 employees. Now to make the Standard Deviation graph, we will need probability distribution of each number in data. To calculate probability distribution in excel, we will need mean and standard deviation.

Preparing Data For Standard Deviation Chart (Graph) or say Bell Curve
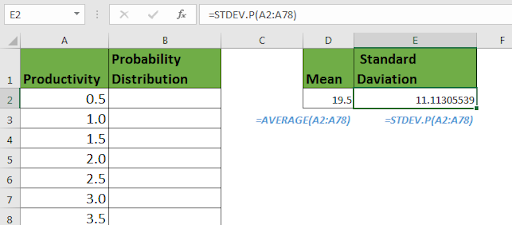
Now, to plot a bell graph or say standard deviation chart of this, we first need to calculated the Mean of data, and standard deviation in excel.
To calculate mean, use AVERAGE function.
To calculate standard deviation of entire population use STDEV.P

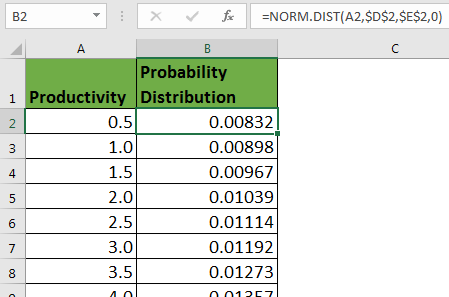
Now, since we have, mean and Standard Deviation, we can calculate Normal distribution.
Use NORM.DIST function.
Copy this formula down the cells.
Since we need to calculate probability distribution of each employee, we give absolute reference of A2 and we lock MEAN and STANDARD DEVIATION.

Plotting Standard Deviation Chart in Excel
Now since we have every ingredient for preparing our Deviation curve, we will use excel charts to get the bell curve.
Follow these steps:
And you will have the bell curve or say standard deviation chart.

Since we have a large standard deviation, the standard deviation is wider. If we reduce the standard deviation, the bell curve will be more lean toward the mean of data. You can see that, when we reduce the standard deviation, the curve get more lean.

So yeah guys, using this method, you can easily create a bell curve or standard deviation graph/chart in excel. The standard deviation curve will be slim if SD is low, higher standard deviation value will lead to wider bell curve.
Related Data:
How to use the STDEV Function in Excel
How to use the STDEV.P Function in Excel
How To Calculate MODE function in Excel
How To Calculate Mean in Excel
Popular Articles
50 Excel Shortcut to Increase Your Productivity : Get faster at your task. These 50 shortcuts will make you work even faster on Excel.
How to use the VLOOKUP Function in Excel : This is one of the most used and popular functions of excel that is used to lookup value from different ranges and sheets.
How to use the COUNTIF function in Excel : Count values with conditions using this amazing function. You don't need to filter your data to count specific values. Countif function is essential to prepare your dashboard.
How to use the SUMIF Function in Excel : This is another dashboard essential function. This helps you sum up values on specific conditions.
The applications/code on this site are distributed as is and without warranties or liability. In no event shall the owner of the copyrights, or the authors of the applications/code be liable for any loss of profit, any problems or any damage resulting from the use or evaluation of the applications/code.
Hello. I'm having a problem with the step NORM.DIST when i type in the mean and standard deviation an error jumps out telling me that the formula is not correct.
Cause You stupid duh