In this article, we will learn about how to calculate the coefficient of variation in Excel.
The coefficient of variation is a statistical measure of a set of data around mean or average. This measure is used to analyze the difference of spread in the data relative to the mean or average value. Coefficient of variation is derived by dividing the standard deviation by the mean or average.
In simple words, it shows by what percentage data varies from its mean. Standard deviation can be the same for different data ranges but their coefficient of variation may not be the same.
In Statistical mathematics
Let’s use this mathematical equation in excel function formula on the data range shown below.

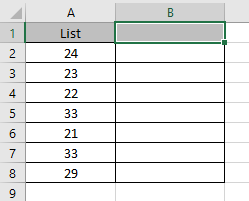
Here we have a range of numbers from A2 to A8. We will find out the coefficient of variation of the range.
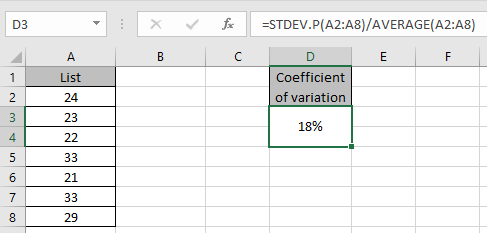
Use the formula to get the coefficient of variation
Explanation:
STDEV.P function gets the standard deviation of the data ignoring Text or boolean values. And the Average function returns the mean of the range.

Press Enter to get the coefficient of variation of the range.

As you can see we have the coefficient of variation of the data range.
Hope you understood how to get the coefficient of variation using Standard deviation and average function in Excel. Explore more articles on Excel functions here. Please feel free to state your query or feedback for the above article.
Related Data:
How to Use STDEV Function in Excel
How to Use STDEV.P Function in Excel
How to perform Regressions Analysis in Excel
How To Calculate MODE in Excel
How To Calculate Mean in Excel
Popular Articles:
50 Excel Shortcuts to Increase Your Productivity
How to use the VLOOKUP Function in Excel
The applications/code on this site are distributed as is and without warranties or liability. In no event shall the owner of the copyrights, or the authors of the applications/code be liable for any loss of profit, any problems or any damage resulting from the use or evaluation of the applications/code.