

We use the variance of data to estimate the range of future value in series. The variance tells how much data can vary from the mean of the data set. Variance is often referred to as error value. It is not the most trusted statistic and we don't use it alone to predict future value.
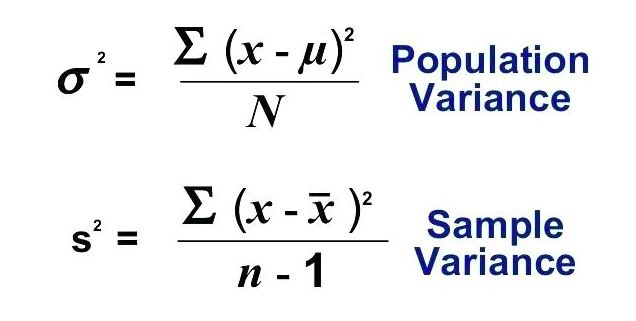
If speaking mathematically, Variance is an average of squared difference of data points from the mean of the data. Variance is the squared value of standard deviation. Below are the two formulas of variance.
We won't need to use these formulas to calculate variance in Excel. Excel has two formulas VAR.P and VAR.S to do so. If you just want to know how to calculate variance in Excel use the formulas as described below. If you want to know what is variance and when to use which variance formula, read the whole article.
Let's take an example.
I launched my website in Jan 2019. Here I have data of new users joined in every month on my website. I want to know the variance of this data.
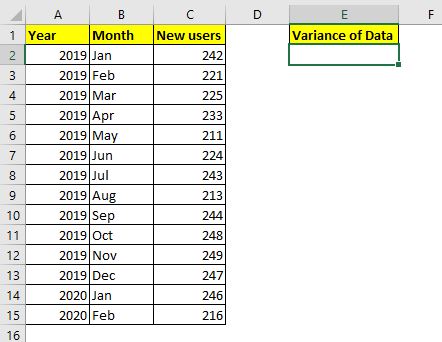
This is complete data. When we capture complete data (entire population) we calculate the variance of population (why? I'll explain it later in the article). The Excel function for calculating Variance of population is VAR.P. The syntax of VAR.P is
Number1, number2,...: these are the numbers of which you want to calculate variance.
The first number is compulsory.
Let's use this formula to calculate the variance of our data. We have data in cell C2:C15. So the formula will be:
| =VAR.P(C2:C15) |
This returns a value 186.4285714, which is quite a large variance given our data.

Since my website was launched in from Jan 2019, I have all the data. Assuming I launched my website long ago but the data that I have is only from Jan 2019 to Feb 2020. I don't have complete data. It is only a sample data then. In that case, I will not use VAR.P instead I will use the VAR.S function to calculate the Variance.
| =VAR.S(C2:C15) |
The VAR.S function returns a larger variance than VAR.P. It returns 200.7692308.
So yeah, this is how you calculate Variance in Excel. But how do these variance functions calculate these numbers? If you know it you can understand these numbers more and use it wisely. Otherwise these numbers are just random numbers. To understand it, we need to calculate the variance manually.
Calculate Variance of Population Manually in Excel
We will use the same data that we used in the above example. The mathematical formula for Variance of Population is: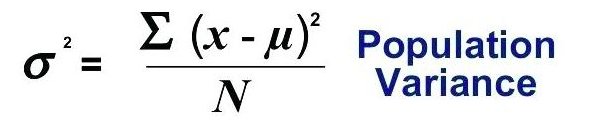
To calculate variance we need to calculate mean (AVERAGE) of data, difference of each value from mean, sum them up and finally divide that sum with the total number of observations.
Step 1. Calculate Mean of Data
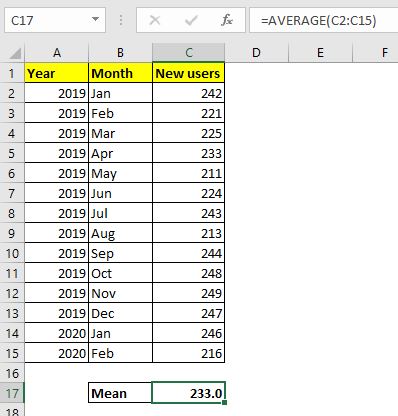
To calculate mean of data in Excel we use the AVERAGE function.
Use this formula in cell C17 (or wherever you like).
| =AVERAGE(C2:C15) |
This returns 233.0.
Step 2: Find the difference of each data point from mean
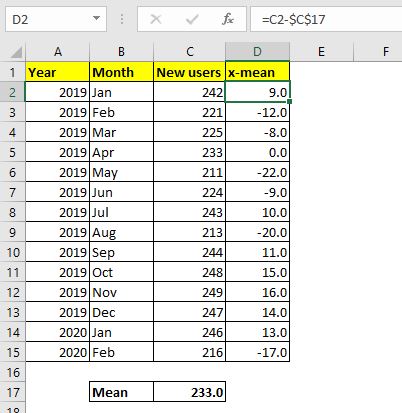
Now go to cell D2 and subtract mean (C17) from C2 (x). Use this formula in D2 and drag it down to D15.
| =C2-$C$17 |
Step 3: Squire Each Difference.
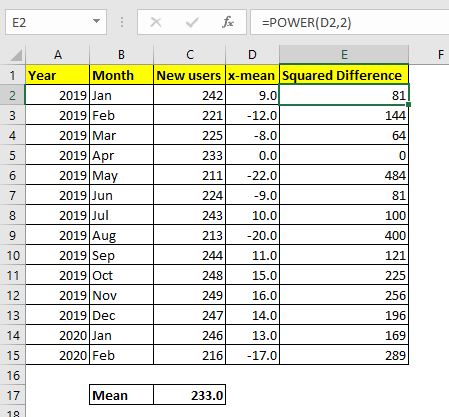
Now we need to square each difference we got here. In cell E2 write the formula below and drag down to E15:
| =POWER(D2,2) |
Step 4: Sum The Squares
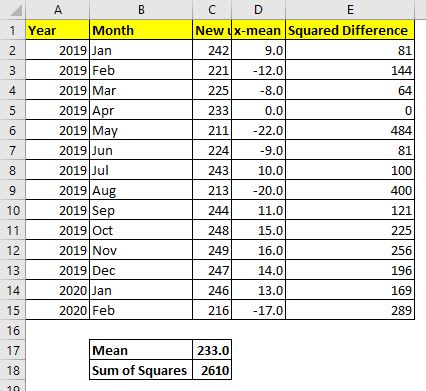
Now we need to sum up these squared differences. So use this formula in cell C18:
| =SUM(E2:E13) |
Final Step: Divide the Sum of Squares with number of observations.
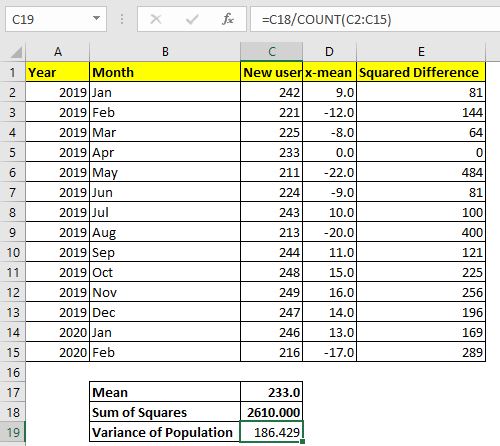
I have 14 observations. You can calculate using the COUNT function if you want.
Use this formula in Cell C19 to calculate the Variance of population.
| =C18/COUNT(C2:C15) |
This returns the value 186.429... which is exactly the same as the variance returned by the Excel variance formula VAR.P above.
Now that you know how variance of population is calculated manually in Excel you will be able to know how to use it in actual analysis.
Calculate Variance of Sample Manually in Excel
In most of the cases it is impossible to capture all the data for analysis. We usually pick a random sample from the data and analyse it to interpret the nature of data. In that case we if we use the variance of population it can be destructive analysis. To be on the safe side, we use the Variance of Sample formula. The formula for the Variance of Sample is:
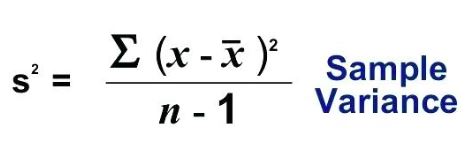
The only difference in sample and population variance is the denominator. In sample variance, we subtract one from the number of observations (n-1). This is called unbiased analysis. This ensures that the data is not underestimated and the possible error range is a bit wider.
To calculate the variance of sample manually in Excel, we need to repeat steps 1 to 4 of variance of population. In the final step use the below formula:
| =C18/(COUNT(C2:C15)-1) |
This returns 200.769. This is exactly the same as the variance returned by the function VAR.S. It takes a larger error range than VAR.P to ensure less chance of mistakes in prediction.
The variance of data is not that trusted for prediction. We calculate standard deviation which is the square root of variance and many other statistics to minimize the chances of error in prediction.
So yeah guys, this is how you can calculate variance in excel. I hope it was explanatory and helpful. If you have any doubts about this variance in excel or any other statistics, the comments section is all yours.
Related Articles
How to Calculate Standard Deviation in Excel : To calculate the standard deviation we have multiple formulas. The standard deviation is simply the square root of the variance. It tells more about the data than variance.
How to use the VAR.P function in Excel : Calculate the variance for the population data numbers in excel using the VAR.P function
How to use the STDEV.P function in Excel : Calculate the standard deviation for the population data numbers in excel using the VAR.P function
How to use the DSTDEVP function in Excel : Calculate the standard deviation for the sample data numbers having multiple criteria in excel using the DSTDEVP function
How to use the VAR function in Excel : Calculate the variance for the sample data numbers in excel using the VAR function.
Regressions Analysis in Excel : Regression is an Analysis Tool, which we use for analyzing large amounts of data and making forecasts and predictions in Microsoft Excel.
How to Create Standard Deviation Graph : The standard deviation tells how much the data is clustered around the mean of the data.
Popular Articles:
50 Excel Shortcuts to Increase Your Productivity | Get faster at your task. These 50 shortcuts will make you work even faster on Excel.
The VLOOKUP Function in Excel | This is one of the most used and popular functions of excel that is used to lookup value from different ranges and sheets.
COUNTIF in Excel 2016 | Count values with conditions using this amazing function. You don't need to filter your data to count specific values. Countif function is essential to prepare your dashboard.
How to Use SUMIF Function in Excel | This is another dashboard essential function. This helps you sum up values on specific conditions.
The applications/code on this site are distributed as is and without warranties or liability. In no event shall the owner of the copyrights, or the authors of the applications/code be liable for any loss of profit, any problems or any damage resulting from the use or evaluation of the applications/code.


