About Dashboard:
Human resources: - Human Resources is play a very key role to an organization. Human resource are having so many responsibilities such as hire the candidate for a company, and ensuring they would be a good performer and check them previous records.
Human resources is work for to make the policies for company about the Leaves, Salary Distribution, Manpower, Employee Data Manage, Performance Allowances, and Provident Fund etc.
Human resources dashboards are useful to analyze the performance and improvement area of resources, employee satisfaction. We can finalize the salary standard for every levels and designation accordingly.
Let’s understand with a dashboard how we can prepare it and how it will be useful for us to analyze and maintain the company standard.

Chart:-Distribution of Employee Years of Service

Column Chart used to show the distribution of Employee years of service. In this chart we can see that 20 Employees are there whose services is around 1.75 years and around 6 or 7 employees are there whose services is around 0.25 years.
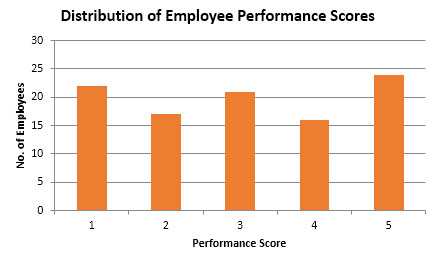
Chart:-Distribution of Employee Performance Scores

Column Chart used to show the distribution of Employee in Performance score. 20+ employees are there who scored 1.
Chart:-Distribution of No. of Sick Days Taken

Column Chart used to show the distribution of number of sick days taken. Through this chart we can analyze that 20+ employees are there who has taken 3 sick leaves and 10+ employee are there who has taken 6 sick days.
Chart:-Average Years of Service by Department

Column Chart used to show the average year to every department. Through this chart we can analyze that marketing team’s service year is more comparatively other teams.
Chart:-Average Performance Score by Department

Column Chart used to show the average performance score achieved by every department. Through this chart we can analyze that Customer Support team’s performance is very good to other departments.
Chart:-No. of Sick Days Taken by Department

Column Chart used to show the distribution of number of sick days taken. Through this chart we can analyze that sales department has taken the more Sick days leaves comparatively other departments.
The applications/code on this site are distributed as is and without warranties or liability. In no event shall the owner of the copyrights, or the authors of the applications/code be liable for any loss of profit, any problems or any damage resulting from the use or evaluation of the applications/code.
please send me on my email.