

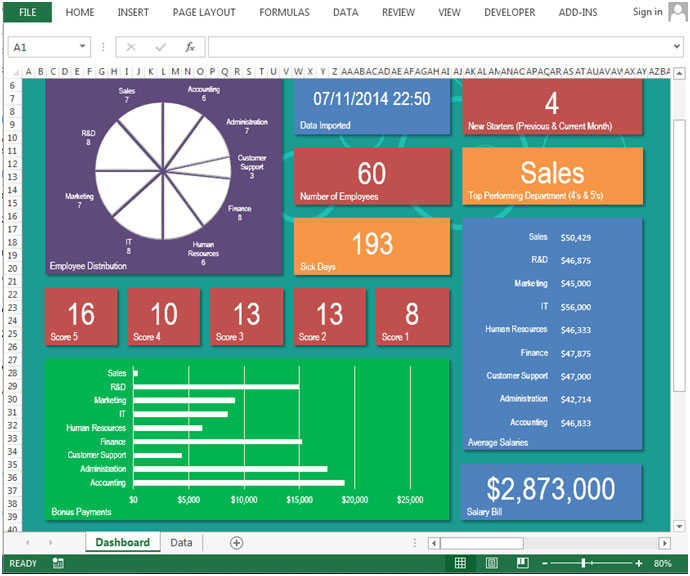
About Dashboard:
Human resources: - Human Resources play a very key role in an organization. Human resource are have so many responsibilities such as hiring the candidates for a company, and ensuring they wouldperform well and check their previous records.
Human resources makes policies regarding Leaves, Salary Distribution, Manpower, Employee Data Manage, Performance Allowances, and Provident Fund etc.
Human resources dashboards are useful to analyze the performance and improvement area of resources, employee satisfaction. We can finalize the salary standard for every level and designation accordingly.
Let’s understand with a dashboard how we can prepare it and how it will be useful for us to analyze and maintain the company standard.

When you will click on this tab, you have select the file from your system to import the data into the Excel file, and then you will get the appropriate dashboard.
Distribution Chart

The above chart show the analysis about the employee contribution in every department. To prepare this chart, we used the Pie chart, where we can easily identify the employee distribution in every department.

In this tab we can see that at what time and what day we had imported the data. It will be helpful for data authenticity.The above shown picture is showing that last time we had imported the data on 14-Nov-2014 @15:19.
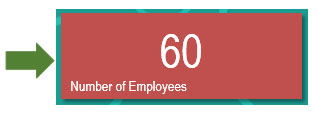
In this tab we can see the total number of employee, who are working in the company. In the above shown we can see that there are 60 employees working.

In this tab we can see the total number of Sick days which are taken by the employees. In above shown picture we can consider that 193 sick leaves were taken by the total number of employees.

These tabs are showing how many employees are there who are having the Score 5, in the above shown picture we can analyze that in this dashboard we gave 16 employees who scored 16, 10 employees scored 4, 13 employees scored 3, 13 employees scored 2, and 8 employees are there who scored 8 score.

In this tab we can see that there are 5 new employees who have joined in the previous and current month.
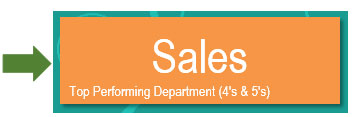
In this tab we can see the top performing department, in the above shown picture we can see that Sales has performed very well compared to other departments.

By this table we can see the average salaries of every department. In this table we can analyze that IT department is getting high average salaries, which is useful for the expenditure department.
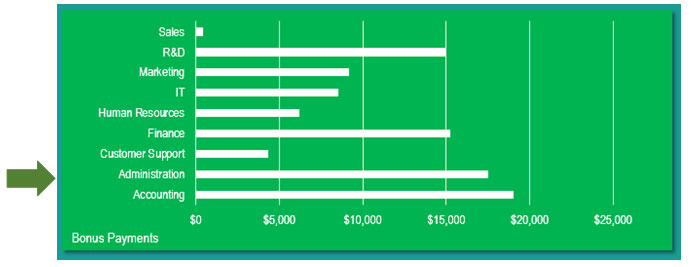
In this chart, a bar chart is used to present the analysis about the bonus salaries for every department. It will helpful to know which department got the highest bonus amount in the company.
In this tab total salary bill is shown for every department.
The applications/code on this site are distributed as is and without warranties or liability. In no event shall the owner of the copyrights, or the authors of the applications/code be liable for any loss of profit, any problems or any damage resulting from the use or evaluation of the applications/code.


