
About Dashboard:
Finance Dashboard is used to present the fiscal performance. This dashboard used to show that how much revenue generated in the year, quick ratio, and short term assets. The idea behind the dashboard of any executive officers they "look" you can get information about the need to drive the business forward.
Basically financial dashboard provide the information about the company’s performance. Through this dashboard we can analyze the company’s performance and growth. On the basis of financial analysis management take the decisions for the Company’s growth and take the appropriate decision about the goals and targets to the company.
Below shown dashboard ispresenting the Financial Analysis.

Drop Down List- Region, Quarter, Year, All Industries, Products & Sales Person
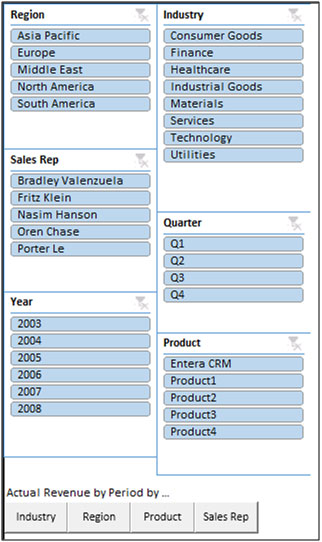
In the left side of the dashboard we have 6 filters, where we can select the Year, Year-Quarter, Industry, Region, Product, and Sales Rep. We will get the information and analyses as per the selected criteria’s.
Chart:- Quarterly Revenue Performance

Line chart used to show the comparison between Actual Revenue generate v/s Forecasted Revenue. Through this chart we can analyze that actual revenue is greater than forecasted revenue in every year’s quarter.
Chart:-Yearly Revenue Performance
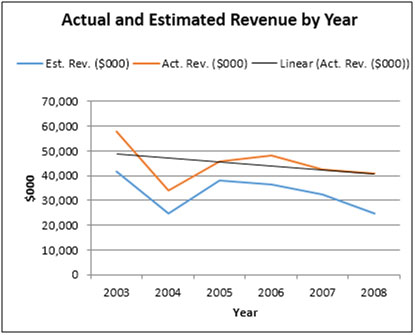
Line chart used to show the comparison between Actual Revenue generate v/s Forecasted Revenue, we have a linear. Through this chart we can analyze that actual revenue is greater than forecasted revenue in every year’s quarter also we can see that Year 2003 and 2006 generated very good revenue.
Chart:- Yearly Revenue Performance
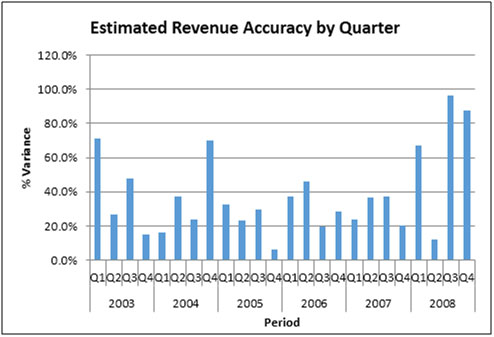
Column chart used to show the variation between quarters in Revenue. In this chart we can easily analyze the quarter 3 to year 2008 generated very high revenue comparatively other departments.
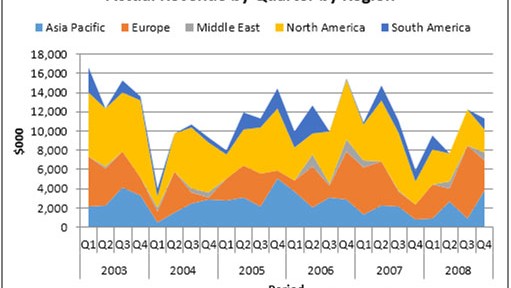
Chart:-Quarterly Revenue by Region
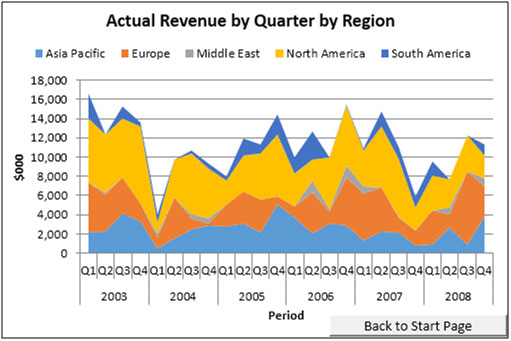
Area chart used to show the variation between quarters in Revenue. In this chart we can see the contribution to every regions quarter wise to every year.
We can easily analyze that Middle East contributed very low revenue comparatively other regions.
The applications/code on this site are distributed as is and without warranties or liability. In no event shall the owner of the copyrights, or the authors of the applications/code be liable for any loss of profit, any problems or any damage resulting from the use or evaluation of the applications/code.


Can you send me this dashboard to my email, Thanks & appreciated
It's great. Can I get this dashboard download?