
Forecasting is a major part of any business management task. And the comparison of actual and forecasted outcomes is critical in every project. Having a good tool or dashboard to calculate the variance between actual and forecast is a must. In this article, we will learn how to compare forecasted and actual data in excel using formulas.
Generic Formula for Variance in Forcast and Actual
| =ACTUAL-FORECAST |
ACTUAL: It is the actual data or amount gathered.
FORECAST: It is the forecasted data or amount.
Here, we are simply subtracting forecast from actual, since we expect the actual to be larger than forecast. It can be the other way around if you are hoping for actual to be less than the forecast.
Let's have an example to make a variance report in Excel.
Here, I have the data on sales of stationery products in different months. Using some excel forecast formula, we have forecasted some sales and unit production to date. As the month goes, we collected the sales and production data in excel. Now we want to create a report that shows the variance between actual and forecasted reports. By the variance, we simply mean the difference between these two values. (no special variance formula is required.)
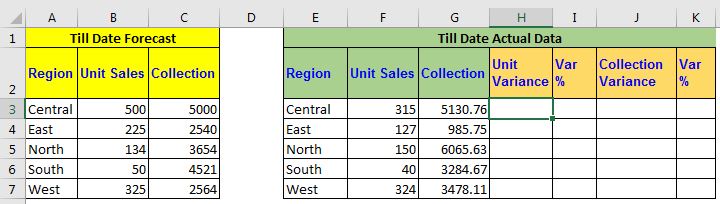 Now let's just subtract the forecasted data from the actual data.
Write this formula in cell H2 and drag down (for this example).
| =F3-B3 |
This will return the difference between Actual and Forecast unit variance. If the actual value exceeds the forecasted value we see a positive difference, else we witness the negative difference.
Similarly, write this formula in J2, to get the variance of collection and drag it down.
| =g3-c3 |
This returns the variance in the collection.
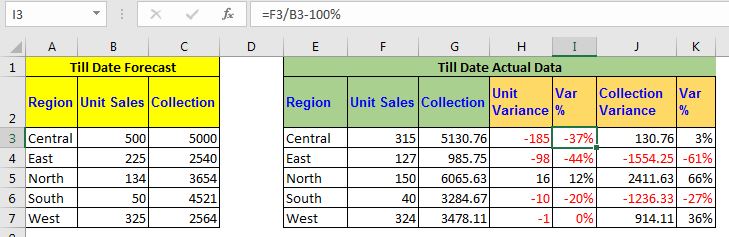
Now to get the percentage variance of units and collection, use these Excel formulas:
| =F3/B3-100% |
| =G3/C3-100% |
A negative percentage will show negative variance and a positive percentage will represent the positive variance.
I have conditionally formatted this column to highlight negative values with red text.
So yeah guys, this how you can use create reports on actual vas forecasted data. This will ease the analysis and help in decision making. I hope I was explanatory enough. If you have any specific query regarding forecasting formulas in excel or any other excel related query, ask in the comments section below.
Related Articles:
Compare 2 Column | Learn how to compare 2 columns in excel. We use the conditional formatting to show the difference in 2 or more columns.
Using If Function to Compare Dates of Two Cells | To compare dates in Excel, we simply use comparing operators like <, >, =, <=, >=, <>.
Compare Two String | To check if two strings are exactly the same or not, we use excel EXACT function. Here's how.
Popular Articles:
50 Excel Shortcuts to Increase Your Productivity | Get faster at your task. These 50 shortcuts will make you work even faster on Excel.
The VLOOKUP Function in Excel | This is one of the most used and popular functions of excel that is used to lookup value from different ranges and sheets.
COUNTIF in Excel 2016 | Count values with conditions using this amazing function. You don't need filter your data to count specific value. Countif function is essential to prepare your dashboard.
How to Use SUMIF Function in Excel | This is another dashboard essential function. This helps you sum up values on specific conditions.
The applications/code on this site are distributed as is and without warranties or liability. In no event shall the owner of the copyrights, or the authors of the applications/code be liable for any loss of profit, any problems or any damage resulting from the use or evaluation of the applications/code.


