
Finance Dashboard: - It is used to present the fiscal performance. This dashboard is used to show how much revenue generated in the year, quick ratio, and short term assets. The idea behind the dashboard of any executive officers isthat just by one "look" you can get information about the need to drive the business forward.
Basically financial dashboard provide the information about the company’s performance. Through this dashboard we can analyze the company’s performance and growth. On the basis of financial analysis management take the decisions for the Company’s growth and take the appropriate decision about the goals and targets to the company.
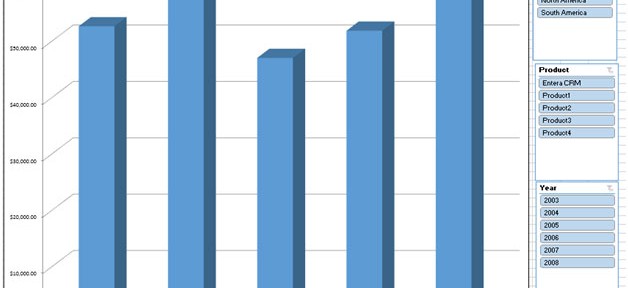
Below shown dashboard ispresenting the Financial Analysis.
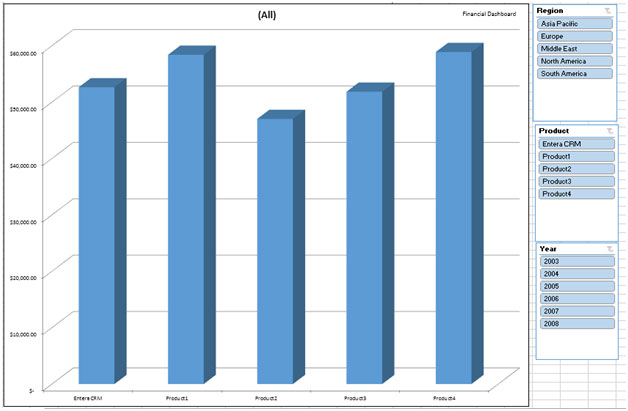
In this dashboard we have three filters: - Region, Product, and Year. We can use this chart to present the revenue according to product, region and year.
Human resources dashboards are useful to analyze the performance and improvement area of resources, employee satisfaction. We can finalize the salary standard for every levels and designation accordingly.
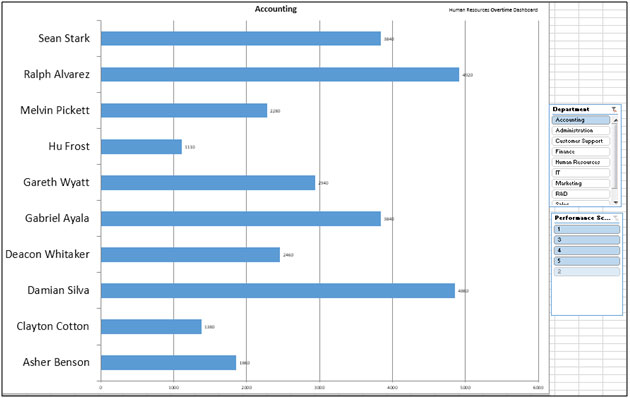
In this chart we have two filters: - Department and Performance Score. According to the selected criteria we can see the graphical picture to every employee’s performance.
Team performance dashboard is used for the analysis of the team’s performance. By using the team performance dashboard we can see the individual performance and make improvements in the performance on the basis of data.Italso helps us to forecast the next vision of targets and achievement and managing things like how we can improve sales, how we can generate revenue etc.

3D pie chart used to show the revenue percentage region wiseof every team member. In this chart we have filters to select the Region.
Sales performance dashboard is useful to analyze the performance of sales. By using the sales performance dashboard we can see the individual performance and make improvement in the performance on the basis of data.It helps us to forecast the next vision of targets and achievement and managing things like how we can improve sales and how we can generate revenue etc.
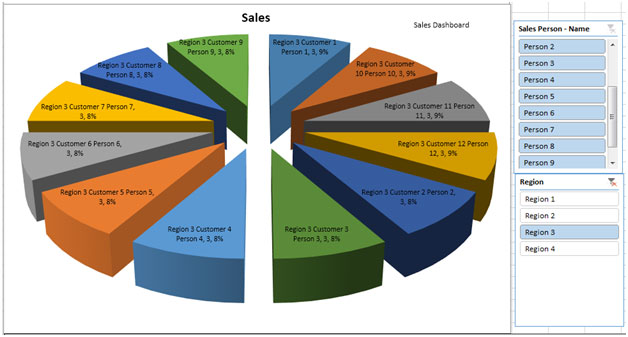
3D pie chart used to show the revenue percentage region wisepf every sales persons. In this chart we have 2 filter: - Region and Product.
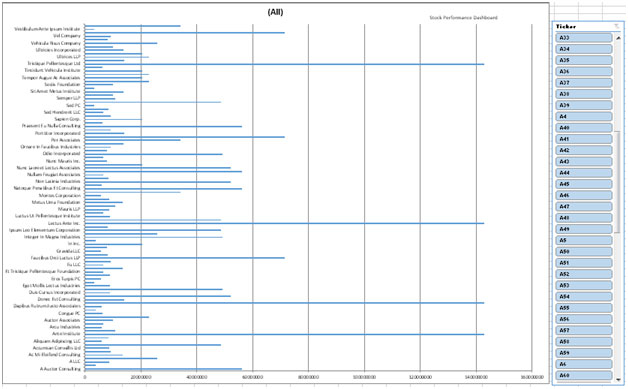
Stock Dashboard is useful to show the share trend; how the share is performing in the last year, last month and last day. It is useful to analyze where we should invest our money.
The applications/code on this site are distributed as is and without warranties or liability. In no event shall the owner of the copyrights, or the authors of the applications/code be liable for any loss of profit, any problems or any damage resulting from the use or evaluation of the applications/code.


