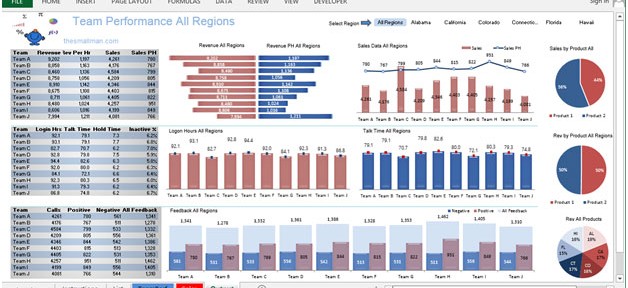
About Dashboard:
This dashboard shows the team’s performance on the basis of team members, product, region and time.
The dashboard contains 3 interactive data tables, 8 interactive charts and 1 static chart to display the management information.
The main objective of this dashboard is to provide key information in one place and see how it is tracking against the key criterions, like performance by region, revenue by team, sales by team, sales by product, revenue by product, etc.
The team’s performance uniquely measures both soft and hard performance factors and helps to drive continuous and curative parameters.
There are many ways in which you can visualize team’s performance data to understand the achievements by various teams. In the month of October, Excel Forum team has launched a dashboard competing in which you are asked to visualize team’s performance data using sample data. The challenge has generated a huge thrill around the community and has fetched 118 incredible entries.
Thanks everyone for participating and making ita huge learning experience for everyone. Excel Forum team has learned several useful dashboard and charting tricks.
In this article, we will show you the steps to create this dashboard.
Let us see the how Dashboard made by Smallman looks:
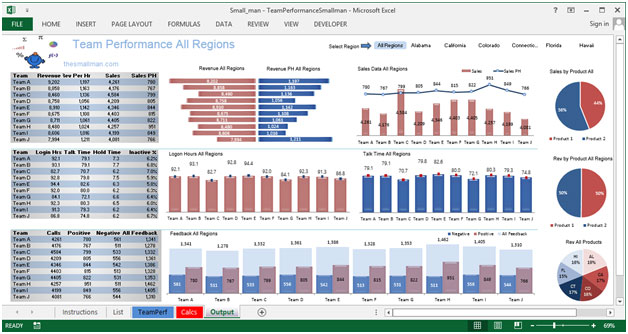
We have divided this dashboard into 5 sections of information. Let us take a look at each one separately.
Section1:
This section is the heart of this dashboard by Smallman. The slicer technique is used to filter all the regions individually; the viewerneeds to select the region & all the related information will be updated dynamically.
![]()
Section 2:
In this section, we will take a look at left portion of the dashboard screen that is displaying details of team performance by revenue, revenue per hour, sales & sales per hour.
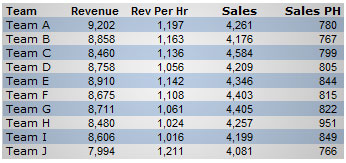
Section 3:
This section highlights team login hours, talk time, hold time & inactive %.
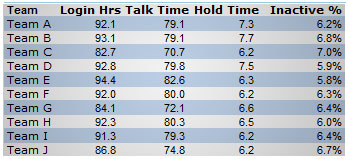
Section 4:
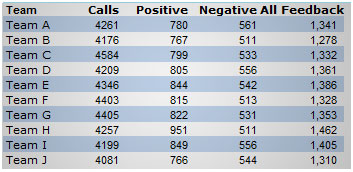
This section covers team calls, positive, negative & all feedback.
Section 5:
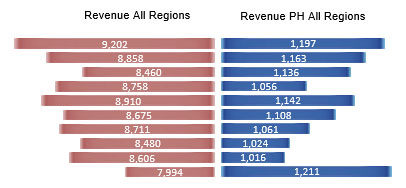
This section provides the revenue-related information for all or selected regions.
Section 7:
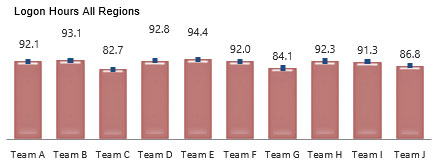
This section provides login hours by region & team wise.
Section8:
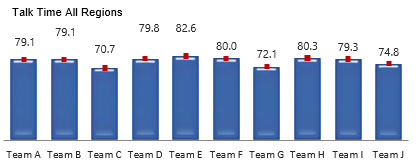
This section focuses on talk time information by region & team wise.
Section9:
In this section, feedback for team performance, whether positive or negative, is shown region wise.

Section10:
This section highlights sales data by region, for all the teams.
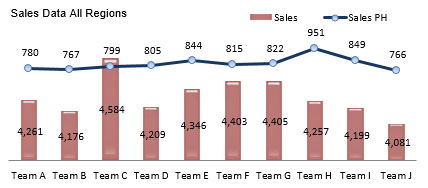
Section 11:
The last section covers the right portion of the dashboard screen, which highlights sales by product, revenue by product for all regions & revenue generated in % by all products.

Using this dashboard,we can get a clear view of the Team Performance,and we can get the information from various points of view.
The applications/code on this site are distributed as is and without warranties or liability. In no event shall the owner of the copyrights, or the authors of the applications/code be liable for any loss of profit, any problems or any damage resulting from the use or evaluation of the applications/code.
Hi, i liked your dashboard.
I'm novice in this type of area.
Can you please help how you put the transparent picture on top of tables. Do you insert it from external website or is there a quicker way to put it on the table?
Thank you in advance
Hi Zak
Sorry for the very late reply. The transparent picture over the top of the text is just for effect. It can be achieved by creating a Text Box, then changing the colour of the text box (grey in my case) and changing the transparency of the text box to say 60%.
I hope that helps you or someone following this post in future.
Take care
Smallman
You guys really went to a lot of effort to describe every segment of this dashboard. You have a very large task doing this for 118 dashboards. The effort will be worthwhile and this dashboard section will be a great reasource for the Excel community.
Thank you
Smallman
Thanks Smallman for the appreciation to our team.
need dashboard help for my job
KPI dashboard for HSE
Couldn't agree more! I've just spent an hour gazing at these things and digging into a couple. Huge thanks must go to all the participants for sharing their work and also to the forum team for spending so much time reviewing them and creating this amazing resource.
Thank you all!