

About Dashboard:
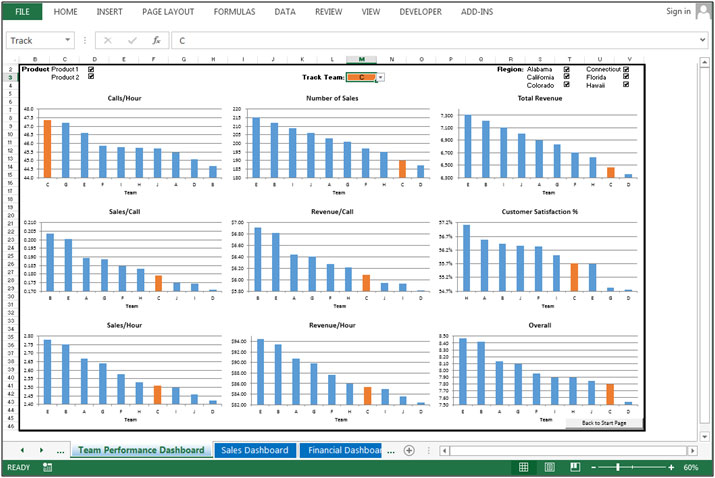
Team Performance dashboard: - It is used for analyzing the team performance. By using the teamperformance dashboard we can take the idea that how our team are performing and where we need to improvement.
By using the team performance dashboard we can see the performance at each and every parameters. We can identify and analyze the weak and strong work of area to every team member and accordingly we can improve and use of the resources.
Also we can plan for future targets on the basis of team performance analyses.
Let’s understand about our below shown dashboard:-
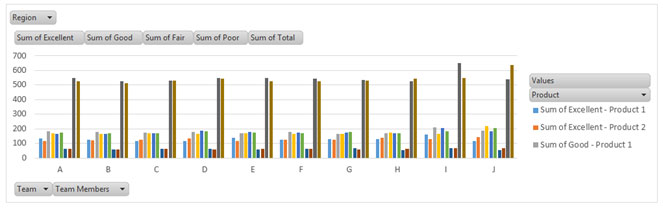
Filters
![]()
In the dashboard on the top few tabs are given to select the Product, Team tracker and Region’s check boxes.
From where we can select the criteria according to our requirement and can see the performance report.
Product Check Boxes preparedto when we check and uncheck to product then we can see the analyses according to selected product.
Track Teams Filter prepared to track the particular team in dashboard, when we select team from the drop down list selected team will get highlighted.
Region Check Boxes prepared to show the analyses according to selected regions.
Chart:- Calls/Hour

Column chart used to show the calls/hour team wise. Where we can see thatTeam C is doing more calls per hour comparatively other teams, and Team B is doing less calls per hour comparatively other teams.
Chart:-Number of Sales

Column chart used to show the number of sales team wise. Where we can see that Team E is doing more sales comparatively other teams, and Team D is doing less sales comparatively other teams.
Chart: -Total Revenue

Column chart used to show the total revenue team wise. Where we can see that Team E is generating more Revenue comparatively other teams, and Team D is generating less Revenue comparatively other teams.
Chart: - Sales/Call
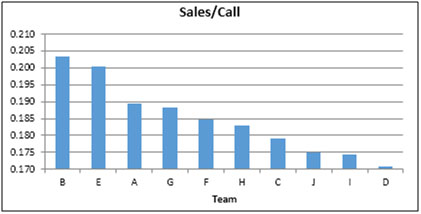
Column chart used to show the sales per call team wise. Where we can see that Team B is generating more sales per call comparatively other teams, and Team D is generating less sales per callcomparatively other teams.
Chart: - Revenue/Call
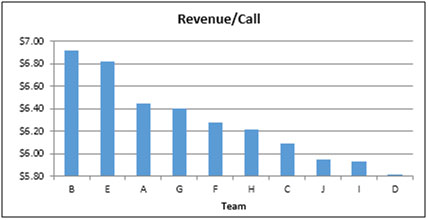
Column chart used to show the Revenue per call team wise. Where we can see that Team B is generating more Revenue per call comparatively other teams, and Team D is generating less Revenue per call comparatively other teams.
Chart: - Customer Satisfaction %
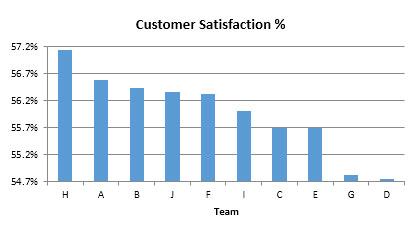
Column chart used to show the Customer satisfaction %age team wise. Where we can see that Team H is having very high ration of customer satisfaction and team D is having very less ration to customer satisfaction.
Chart: - Sales/Hour
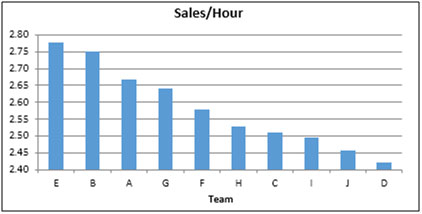
Column chart used to show the sales per hour team wise. Where we can see that Team E is generating more sales per hour comparatively other teams, and Team D is generating less sales per hour comparatively other teams.
Chart: - Revenue/Hour

Column chart used to show the Revenue per hour team wise. Where we can see that Team E is generating more revenue per hour comparatively other teams, and Team D is generating less revenue per hour comparatively other teams.
Chart: - Overall Performance
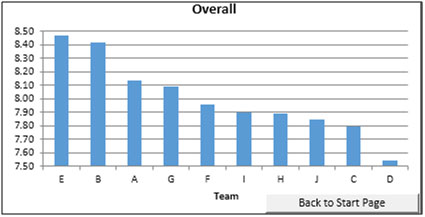
Column chart used to show the overall performance team wise.
Column chart used to show the number of sales team wise. Where we can see that In this chart we can see, there are 4 drop Team C is doing more calls per hour comparatively other teams, and Team B is doing less calls per hour comparatively other teams.
In the above shown chart, there are 4 drop downs available. 1st is to select the region, 2nd is to select the product, 3rd is to select the team and 4th is to select the team member.
In this chart we can analyze the total sales and sales per hour for every team and to every individuals. Accordingly we can analyze that how a team is performing and how a individual is having the potential.
Chart to compare the total sales and Sales per hour.
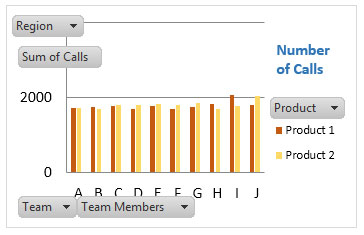
In the above shown chart, there are 4 drop downs available. 1st is to select the region, 2nd is to select the product, 3rd is to select the team and 4th is to select the team member.
In this chart we can analyze about the calls that how many calls are there product wise.
Chart For analyze the CSAT%
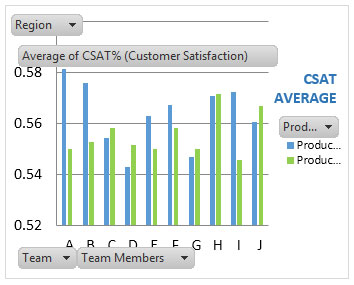
In the above shown chart, there are 4 drop downs available. 1st is to select the region, 2nd is to select the product, 3rd is to select the team and 4th is to select the team member.
In this chart we can analyze the CSAT% for every team and individual consultants as well we can put the filter for products, region and then we can see the performance accordingly.
Chart to analyze the CSAT%

In the above shown chart, there are 4 drop downs available. 1st is to select the region, 2nd is to select the product, 3rd is to select the team and 4th is to select the team member.
In this chart we can analyze the CSAT% for every team and individual consultants as well we can put the filter for products, region and then we can see the performance accordingly.
Chart For analyze the Revenue

In the above shown chart, there are 4 drop downs available. 1st is to select the region, 2nd is to select the product, 3rd is to select the team and 4th is to select the team member.
In this chart we can analyze the total revenue generate by every team and individual consultants.
Chart For analyze the Calls Grading
In the above shown chart, there are 4 drop downs available. 1st is to select the region, 2nd is to select the product, 3rd is to select the team and 4th is to select the team member.
In this chart we can analyze the Calls grading for every region and product to every team and individual by selecting the criteria from the drop down list.
The applications/code on this site are distributed as is and without warranties or liability. In no event shall the owner of the copyrights, or the authors of the applications/code be liable for any loss of profit, any problems or any damage resulting from the use or evaluation of the applications/code.


can i download this dashboard
Very good dashboard - how can i download this dashboard
Excellent dashboard. Congrats!!