
About Dashboard:
This dashboard showscompany’s salesby region, product, customer, sales person& sales analysismonth wise.
If you want to track conversion rate by team, you’ll be able to identify the strengths and weaknesses in the sales process. The key focus of this dashboard is to showsales credibility& management visibility.
There are several ways in which you can visualize sales data to understand the market trends and sales performance. In October month, Excelforum teamhas launched a dashboard competing in which you are asked to visualize data using sample data. The challenge has generated a huge thrill around the community and fetched 118 incredible entries.
In this article, we will show you the steps on how to create this dashboard.
Let us see the how Dashboard made by Ludimax looks:
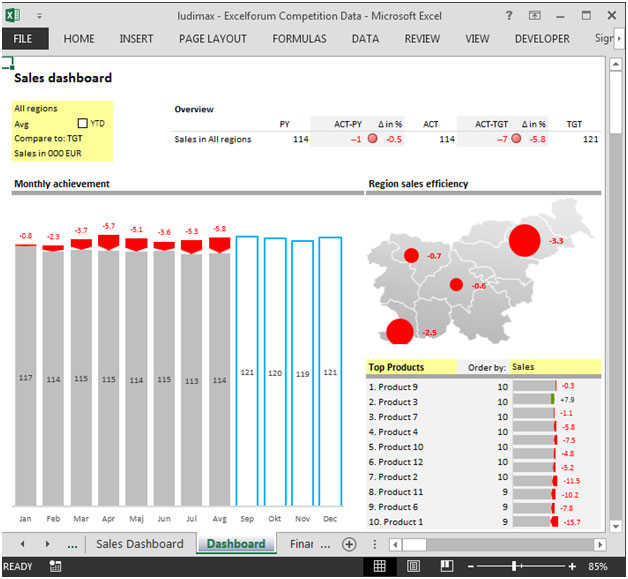

We have divided this dashboard into 8 sections of information. Let us take a look at each one separately.
Section1:
The below picture contains a check box & drop down which provides flexibility to view the average data till YTD which is comparing to Target sales in Euro& provision to select any region from the drop down list.
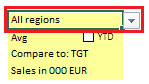

If we check this box then the dashboard will dynamically update its all fields refer below snapshot:

Section2:
The below picture shows per year sales, actual-per year sales, actual sales, actual – target, target for sales in all regions.
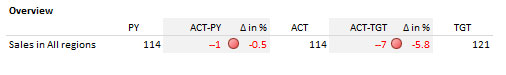
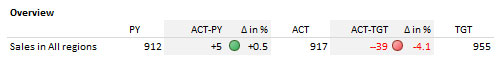
If we click on the checkbox shown in section 1 then the overview picture will change automatically refer below snapshot:
Section3:
This section highlights monthly achievement of sales.

If we click on the checkbox shown in section 1 then the picture will change dynamically & shows average YTD sales for all regions refer below snapshot:

Section4:
This section shows Region sales efficiency by top products, top customers, top salesman. We can select the order by Sales, Growth, Best vs Target & Worst vs Target.
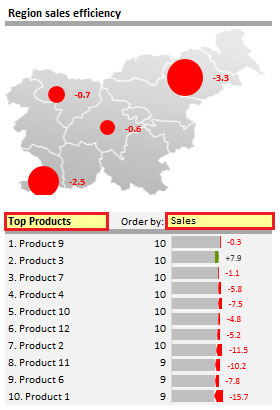
In above picture, there is a interactive map which will update as we change the criteria from drop down list.The dropdown gives the flexibility to view the data from different perspective.
Using this dashboard you can get a clear view of the Sales industry and we can get the information from various point of view.
![]()
The applications/code on this site are distributed as is and without warranties or liability. In no event shall the owner of the copyrights, or the authors of the applications/code be liable for any loss of profit, any problems or any damage resulting from the use or evaluation of the applications/code.


postal coaching for door study material for entrance and other important advice to be able to shape career in a correct way. Thanks
Great info! I recently came across your blog and have been reading along. I thought I would leave my first comment. I don’t know what to say except that I have.
hats off for the blog.it seem that the author had put all his effort in the blog.
Amazing post found here.
I feel very glad to read on this topic. Would you mind updating your blog with some more additional information
Wonderful blog! This is very informative site. I am totally pleased by your excellent work. Many thanks for sharing.
Useful information.I am actual blessed to read this article.thanks for giving us this advantageous information.I acknowledge this post.and I would like bookmark this post.Thanks
I gathered useful information on this point . Thank you posting relative information and its now becoming easier to complete this assignment
I like the part where you say you are doing this to give back but I would assume by all the comments that this is working for you as well.
hey friends this is awesome blog
Nice to be visiting your blog again, it has been months for me. Well this article that i've been waited for so long. I need this article to complete my assignment in the college, and it has same topic with your article. Thanks, great share.
Quality content is the crucial to invite the visitors to visit the site, that's what this website is providing.
autoproj.org |
Very good work. Can I have a link to download your file ? thank you very much !
excellent loving it