
In this article, we will learn how to prepare Spider Chart / Radar Chart in Microsoft Excel 2010.
Spider Chart is a graphical method to show the comparison in between multiple data.It shows the comparison in the two-dimensional chart of three or more quantitative variables form which is represented on axes starting from the same point.
Radar Chart contains 3 types of charts: -Radar, Radar with Markers, and Filled Radar.
We can address Radar chart with so many names: - Spider Chart, Star Chart, Web Chart, Polar Chart, Kiviat Diagram, etc.
Radar Chart.
Let’s take an example and understand how we can use the Radar chart in Excel.
Follow below given steps:-
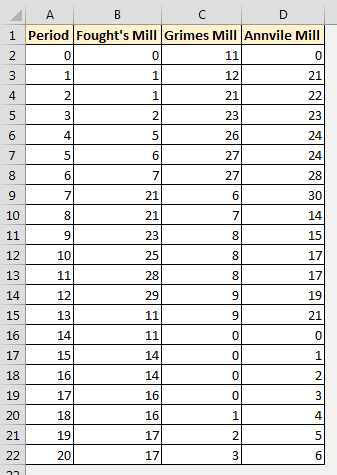
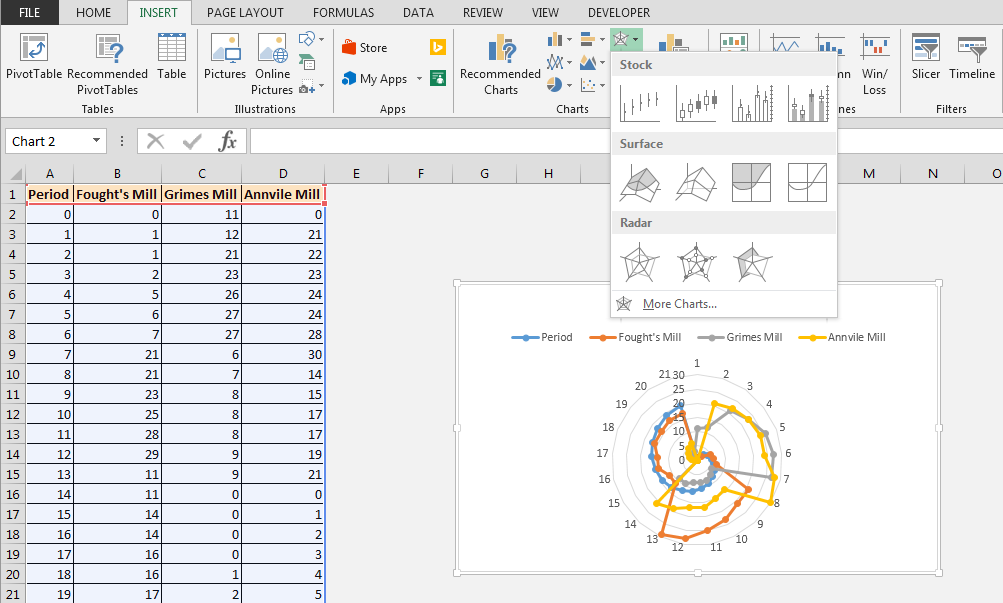
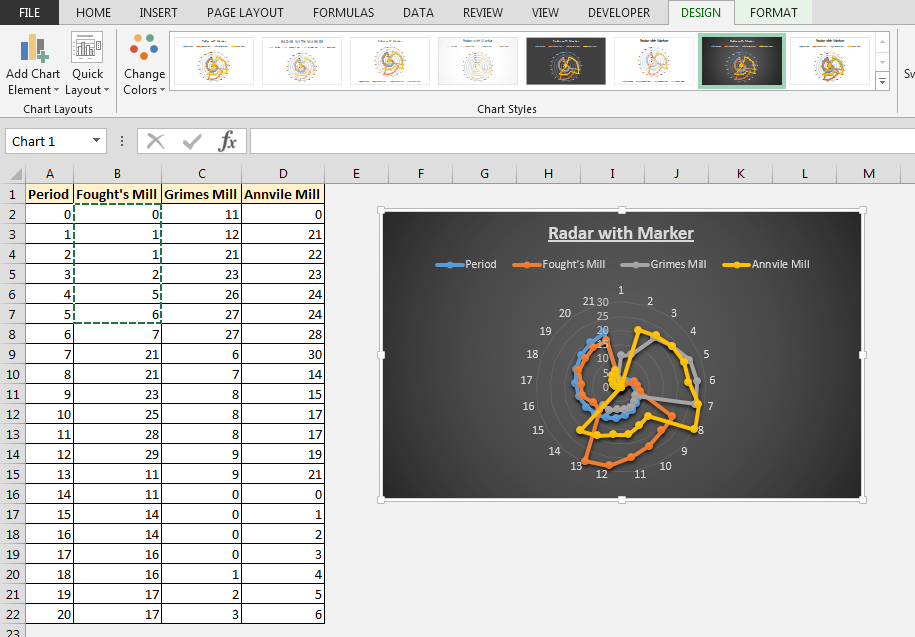
• Select the range A1:D22.
• Go to the Insert tab, in the charts group, select Radar, and from the dropdown list, select Radar with Markers.
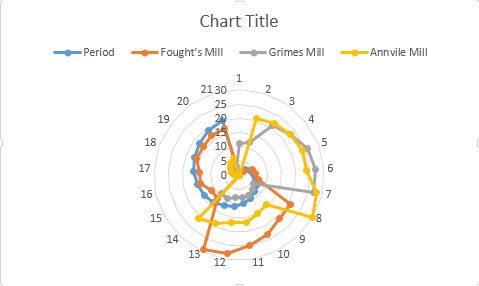
Result:-
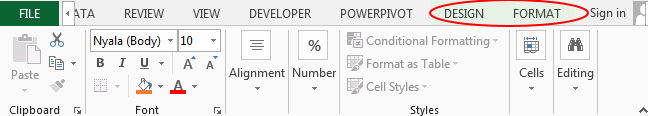
• Go to the Design contextual tab, and choose any chart from the Chart Styles group.
• To add the chart title, double click on the title.
• Rename the text as per the requirement or you can delete it.

This is the way we can create Scatter Chart in Microsoft Excel 2010 and 2013.
The applications/code on this site are distributed as is and without warranties or liability. In no event shall the owner of the copyrights, or the authors of the applications/code be liable for any loss of profit, any problems or any damage resulting from the use or evaluation of the applications/code.


 Download - Radar Chart - xlsx