

About Dashboard:
Sales Performance: -Every company has a product which they need to sell increase the returns. Ultimately if sales improve, the company will grow
Sales performance dashboard is a useful tool to analyze the performance of sales. By using the sales performance dashboard we can see individual performance and make improvements in the performance on the basis of data. It helps us to forecast the next vision of targets and achievements and managing things like improving the sales and how to generate more revenue etc.
Below shown dashboard is useful to analyze sales performance in every field.
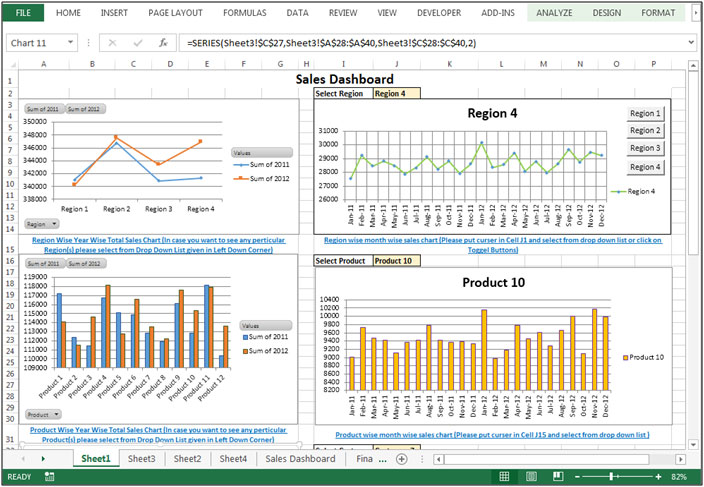
Chart:- Region wise on yearly basis

In the above shown chart we used Line chart. In this chart we can analyze the sales performance region wise and yearly. We can see and identify that region 2 had given a very good performance in the year 2012.
In this chart a drop down list is given from which we can select the particular region and can see the performance of a particular zone.
Chart:-Product wise on yearly basis
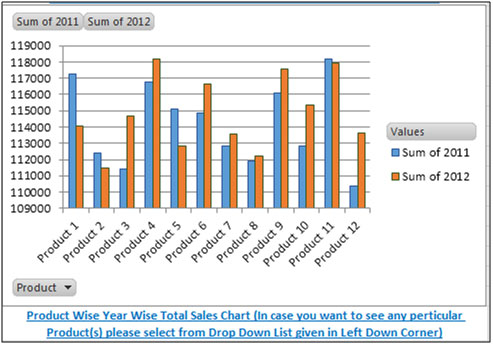
In the above shown chart we used column chart. In this chart we can analyze the sales performance Product wise and yearly. We can see and identify that Product 11 had very good sales in both years.
In this chart a drop down list is given from which we can select the particular product and can see the performance of a particular product.
Chart:-Customer wise yearly performance

In the above shown chart we used Line chart. In this chart we can analyze customer wise on yearly basis. We can see and identify that customer 7 and 8 having good sales in the year 2012. In this chart a drop down list is given from which we can select the particular Customer and can see the performance of a particular product.
Chart:- Sales wise yearly performance
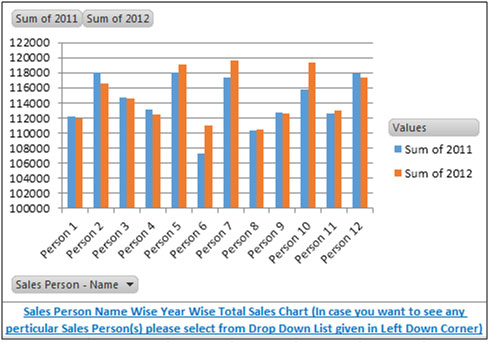
In the above shown chart we used column chart. In this chart we can analyze the yearly sales performance of the sales person. We can see and identify that sales person 7 had very good sales in the year 2012.
In this chart a drop down list is given from which we can select a particular sales person can see the performance ofthat particular sales person.
Chart:- Region wise Monthly Performance
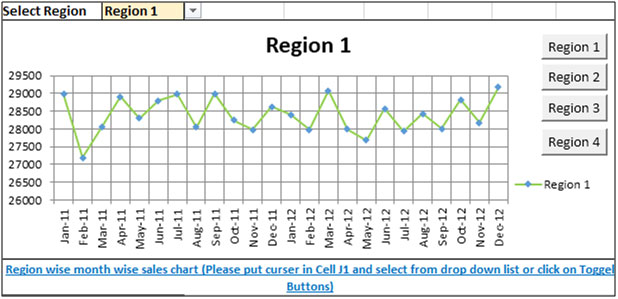
In the above shown chart we used Line chart and use drop down list or click on Toggle Buttons to select the regions. In this chart we can analyze the sales performance on region wise on monthly basis.
In this chart a drop down list is given from which we can select the particular region and can see the performance to a particular zone.
Chart:- Product wise Monthly Performance
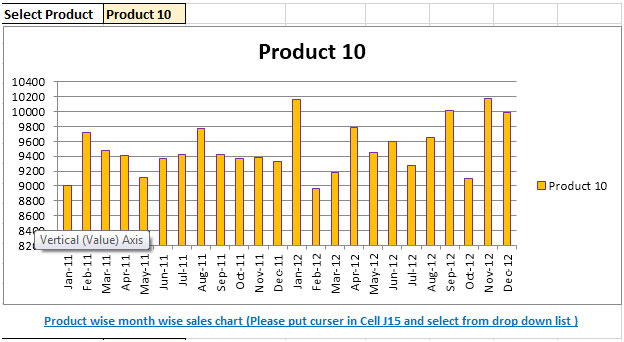
In the above shown chart we used Column chart and adrop down list to select the Product. In this chart we can analyze the sales performance of monthly product performance.
In this chart a drop down list is given from which we can select the particular product andcan see the performance to a particular product monthly analysis.
Chart:- Customer wise Monthly Performance
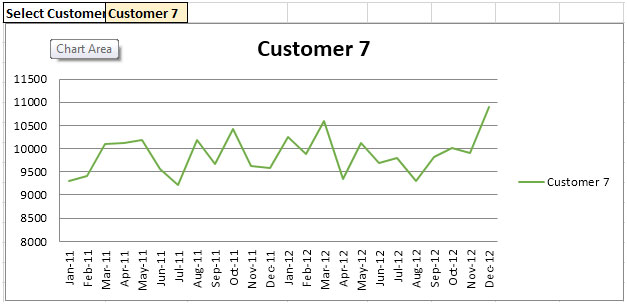
In the above shown chart we used Line chart and adrop down list to select the Customer. In this chart we can analyze the customer performance to the monthly performance.
In this chart a drop down list is given from which we can select the particular Customer and we can see the performance ofthat particular customer monthly analysis.
Chart:- Sales person wise Monthly Performance

In the above shown chart we used Column chart and a drop down list to select the Sales person. In this chart we can analyze the sales performance of every sales person on monthly basis.
In this chart a drop down list is given from which we can select the particular sales person and we can see the performance of that particular sales person.
The applications/code on this site are distributed as is and without warranties or liability. In no event shall the owner of the copyrights, or the authors of the applications/code be liable for any loss of profit, any problems or any damage resulting from the use or evaluation of the applications/code.


We can see and identify that region 2 had given a very good performance in the year 2012.