
About Dashboard:
Sales performance dashboard is useful to analyze the performance of sales. By using the sales performance dashboard we can see the individual performances and make improvement in the performance on the basis of data.It helps us to forecast the next vision of targets and achievement and managing things like how we can improve sales and how we can generate more revenue etc.
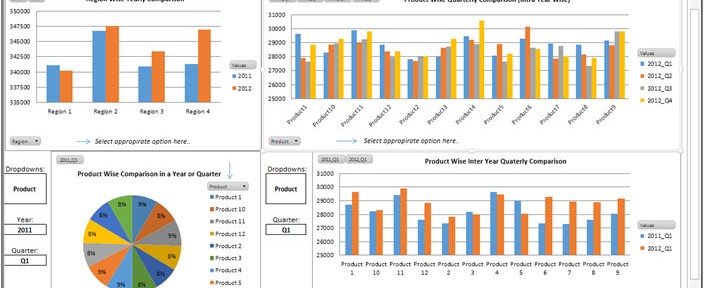
Below shown dashboard is useful to analyze sales performance in every field.
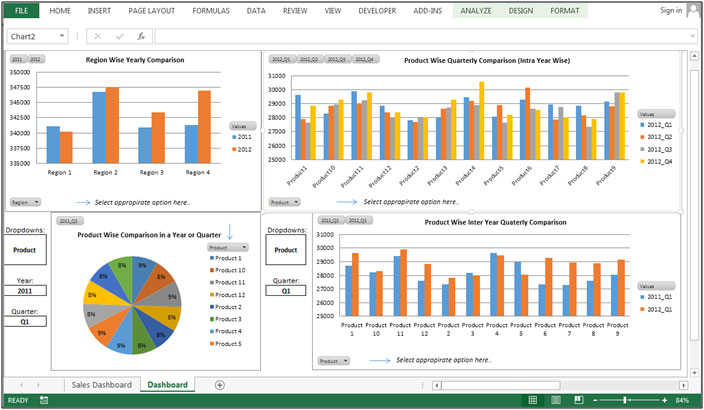
4 Kind of comparisons are: -
1. Criteria Wise Yearly Comparison
2. Criteria Wise Quarterly Comparison (Intra Year Wise)
3. Criteria Wise Comparison in a Year or Quarter
4. Criteria Wise Inter Year Quarterly Comparison
Chart for Yearly Comparison
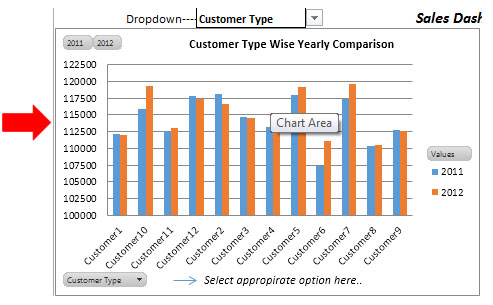
In the above shown chart we can compare the data on yearly basis. In this dashboard we have one drop down to change the criteria. There are three types available to see the comparison Customer Type, Product and Sales person.
Criteria Wise Quarterly Comparison (Intra Year Wise)
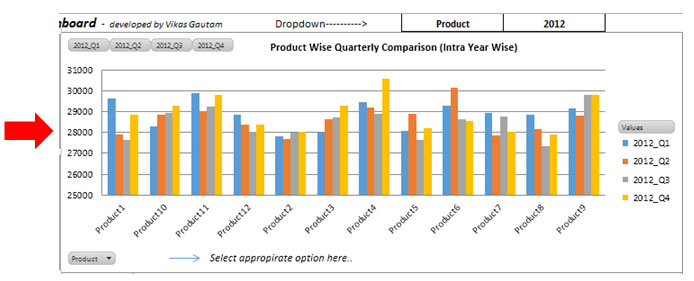
In the above shown chart we can compare the data on Quarterly basis. In this dashboard we have two drop downs to change the criteria. First is available to change the comparison criteria on basis of Customer Type, Product and Sales person and second is available for change the year.
Criteria Wise Comparison in a Year or Quarter

In the above shown chart we can compare the data on Year or Quarter basis. In this dashboard we have three drop downs to change the criteria. First is available to change the comparison criteria on basis of Customer Type, Product and Sales person and second is available for change the year and third is available to change the quarter criteria.
When we set the criteria in the drop down list, the chart will change and will give the picture about the sales performance for the selected year and quarter.
Criteria Wise Inter Year Quarterly Comparison
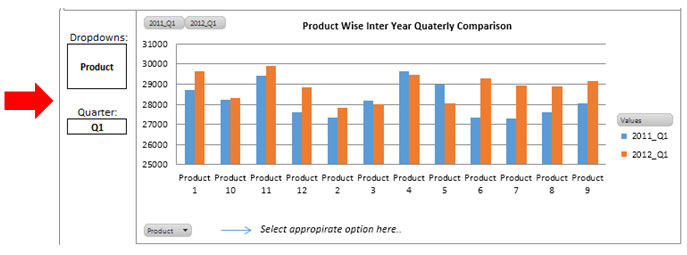
In the above shown chart we can compare the data on Quarter basis in between year. In this dashboard we have two drop downs to change the criteria. First is available to change the comparison criteria on basis of Customer Type, Product and Sales person and second is available for change the quarter criteria.
This chart will compare the quarterly performance in between 2 years, we have to just select the category and quarter, we will get to compare the data and we can forecast for the new targets and set our vision accordingly.
The applications/code on this site are distributed as is and without warranties or liability. In no event shall the owner of the copyrights, or the authors of the applications/code be liable for any loss of profit, any problems or any damage resulting from the use or evaluation of the applications/code.


Hi I was trying to update this for 2014-2015 data and it's mostly working, but how can I change the dropdown selections to say 2014 and 2015 are they editable?
thanks.