
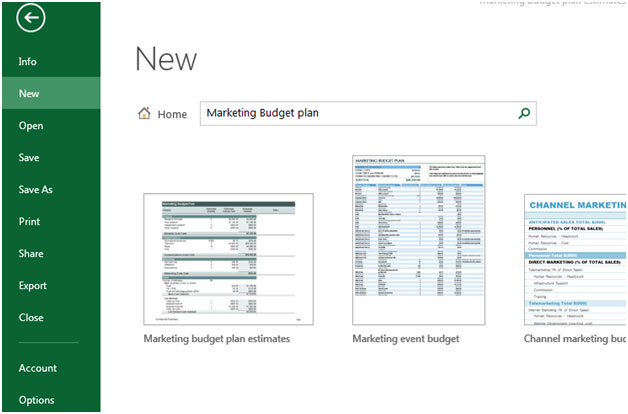
To group and summarize the data, we can create an outline up to eight levels in the data list. To expose the detail for each group, use an outline to display summary rows and columns quickly in Microsoft Excel 2010.
Outline: -An Outline helps to separate the top level and details. It is easy to create an Outline, using Auto Outline option in Microsoft Excel 2010.
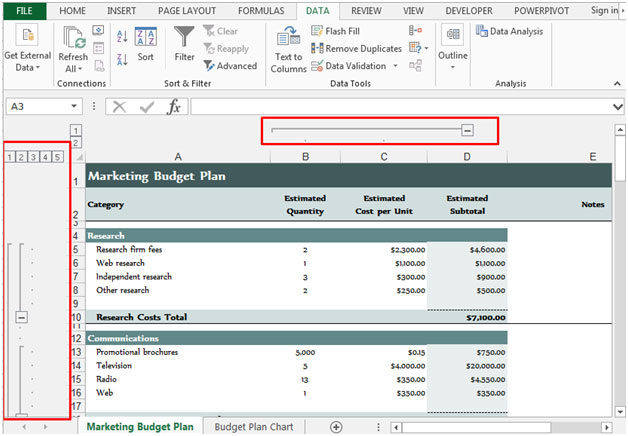
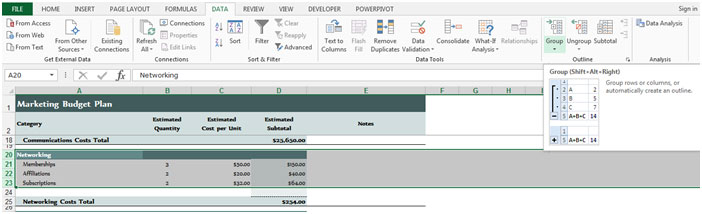
Group: - This is used to automatically create the outline or groups of rows and columns.
To create the Outline manually, follow the below given steps:-


To clear the outline, follow below given steps:-


This is the way by which you can add groups and outlines manually in Microsoft Excel.
The applications/code on this site are distributed as is and without warranties or liability. In no event shall the owner of the copyrights, or the authors of the applications/code be liable for any loss of profit, any problems or any damage resulting from the use or evaluation of the applications/code.


"German Wizard, you are...dee sh1t!
I knew that setting was in there somewhere, thanks for your help."
"From the ""Data"" menu, select ""Group and Outline""
- Select ""Settings"" Here you can tick the box to display subtotals below or above. If you now use any way to group the data (key combo, through the ""Data/Group and Outline/Group"" menu or through the arrows on the ""Pivot Table"" toolbar), the subtotal will always display at the position specified in the settings. "
I too would like to be able to "reverse" the grouping, so that the "summary row" is at the top of the group. This method is more useful to cases where you want to "roll up" some data to just show the top row. Nothing seems to work though, after I try to select rows from bottom to top, etc. Any other way to do this -- Macros? VB?
Is there a way to reverse a group. I would like to have the group drop down, having the header to the sub group on the top.
Please add an example to download. I didn't succeed doing the same steps.